-

-
Trade Like a Pro
-
I'm a Title


Trade Like a Pro
I'm a Title
Smart Money = Options Trader. There is no doubt that the most used tool for institutional and professional traders are options, tracing the evolution of data on options you can have fundamental indications on the movement of the price , useful even to those who do not know the world of options
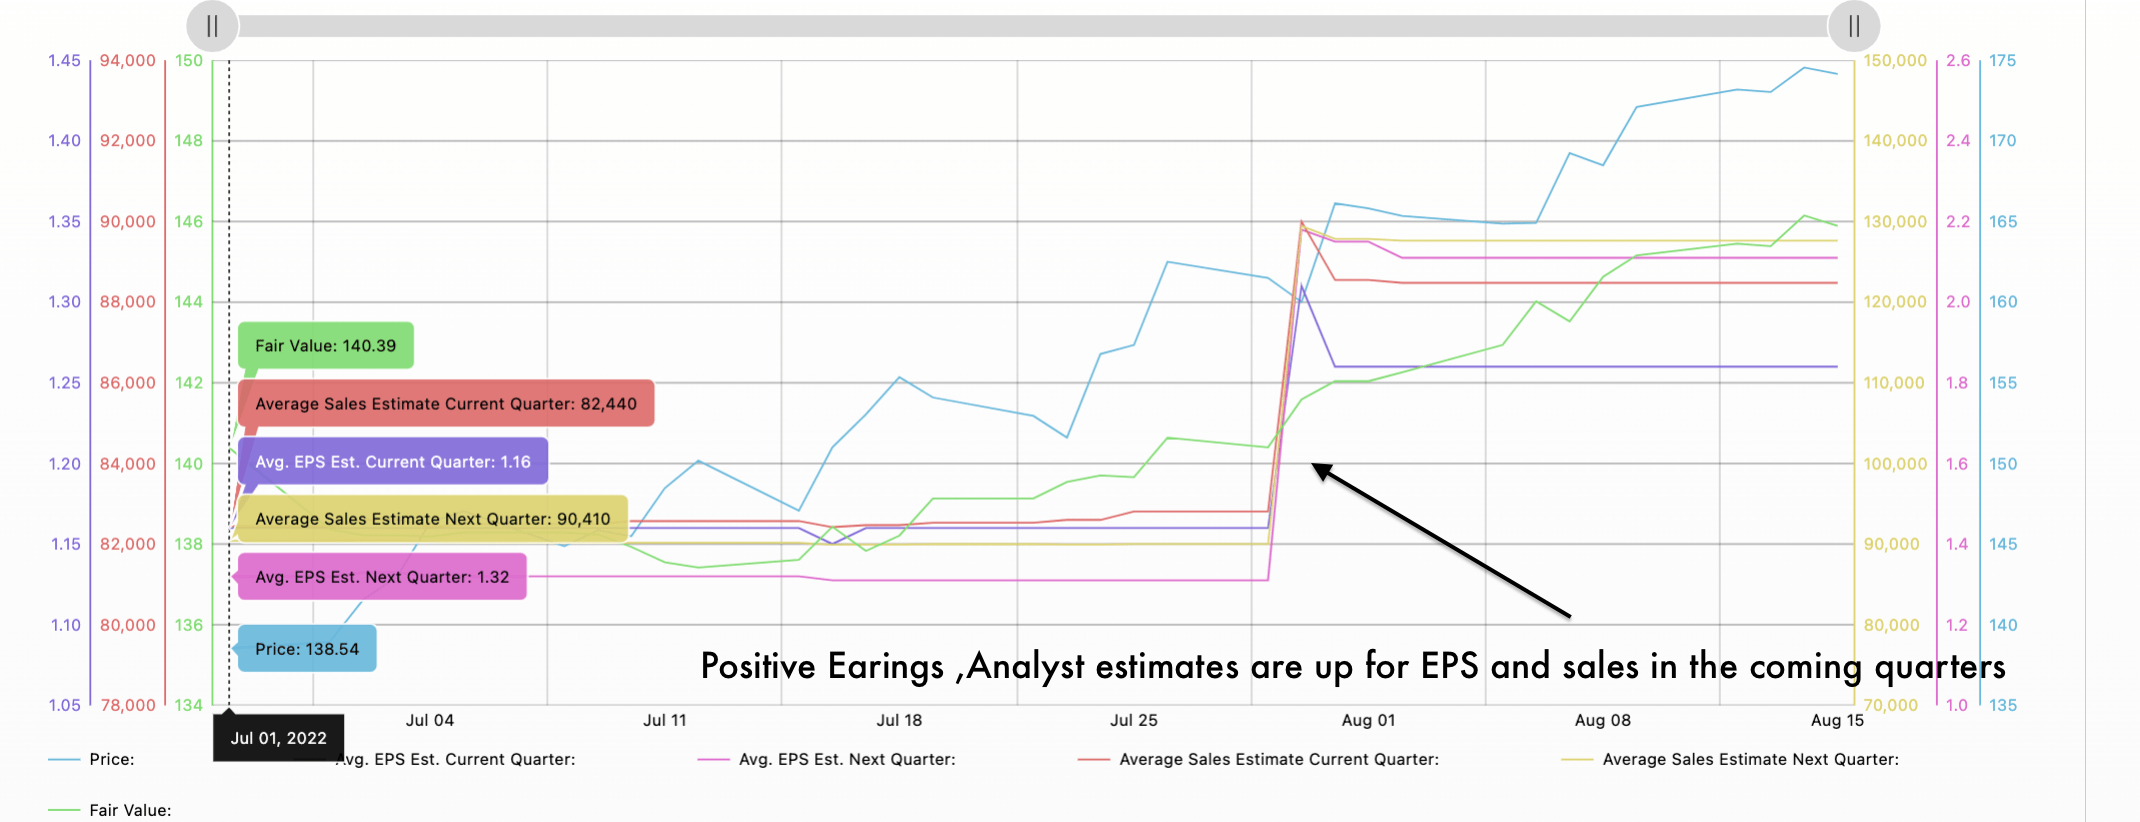
The share price moves according to the estimates made by analysts, with this tool you can trace the evolution of the estimates and anticipate the movements of the market
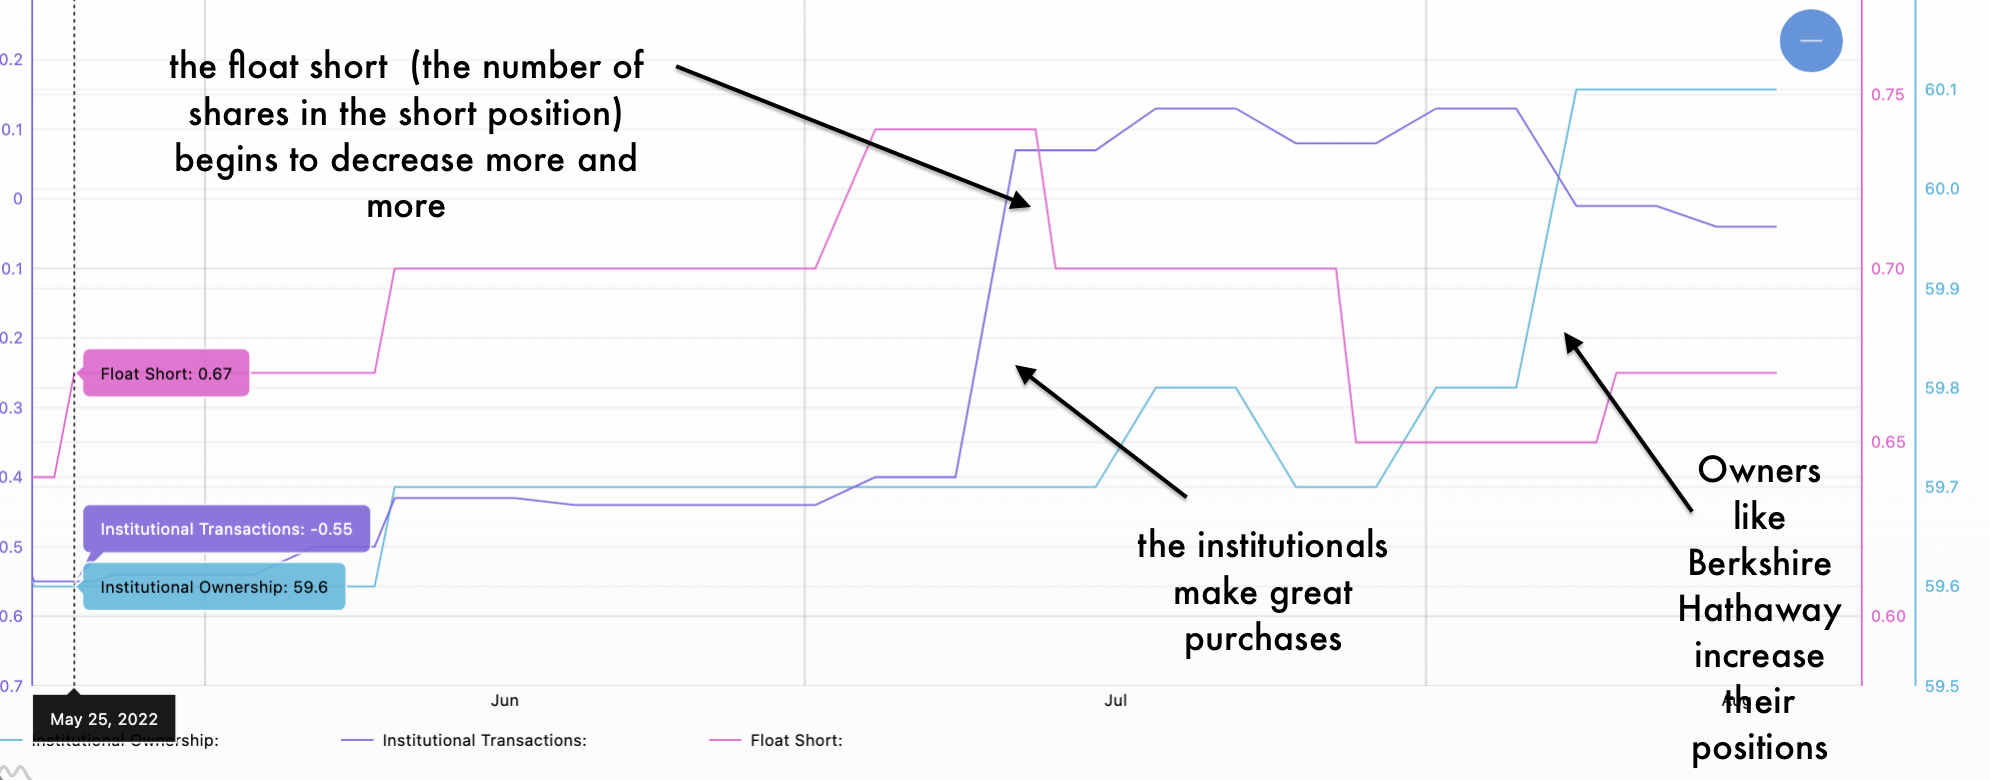
Fundamental data is the most important factor for a successful investment, seeing the performance and acceleration of this data will give you the power to find better opportunities. You can also track the purchases and sales of institutional and insiders.
With the market overview we have provided traders with a powerful tool for selecting countries, sectors and industries to invest in .
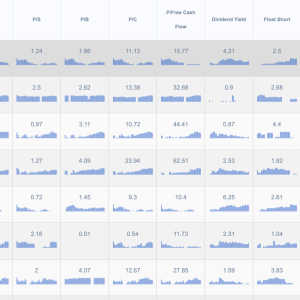
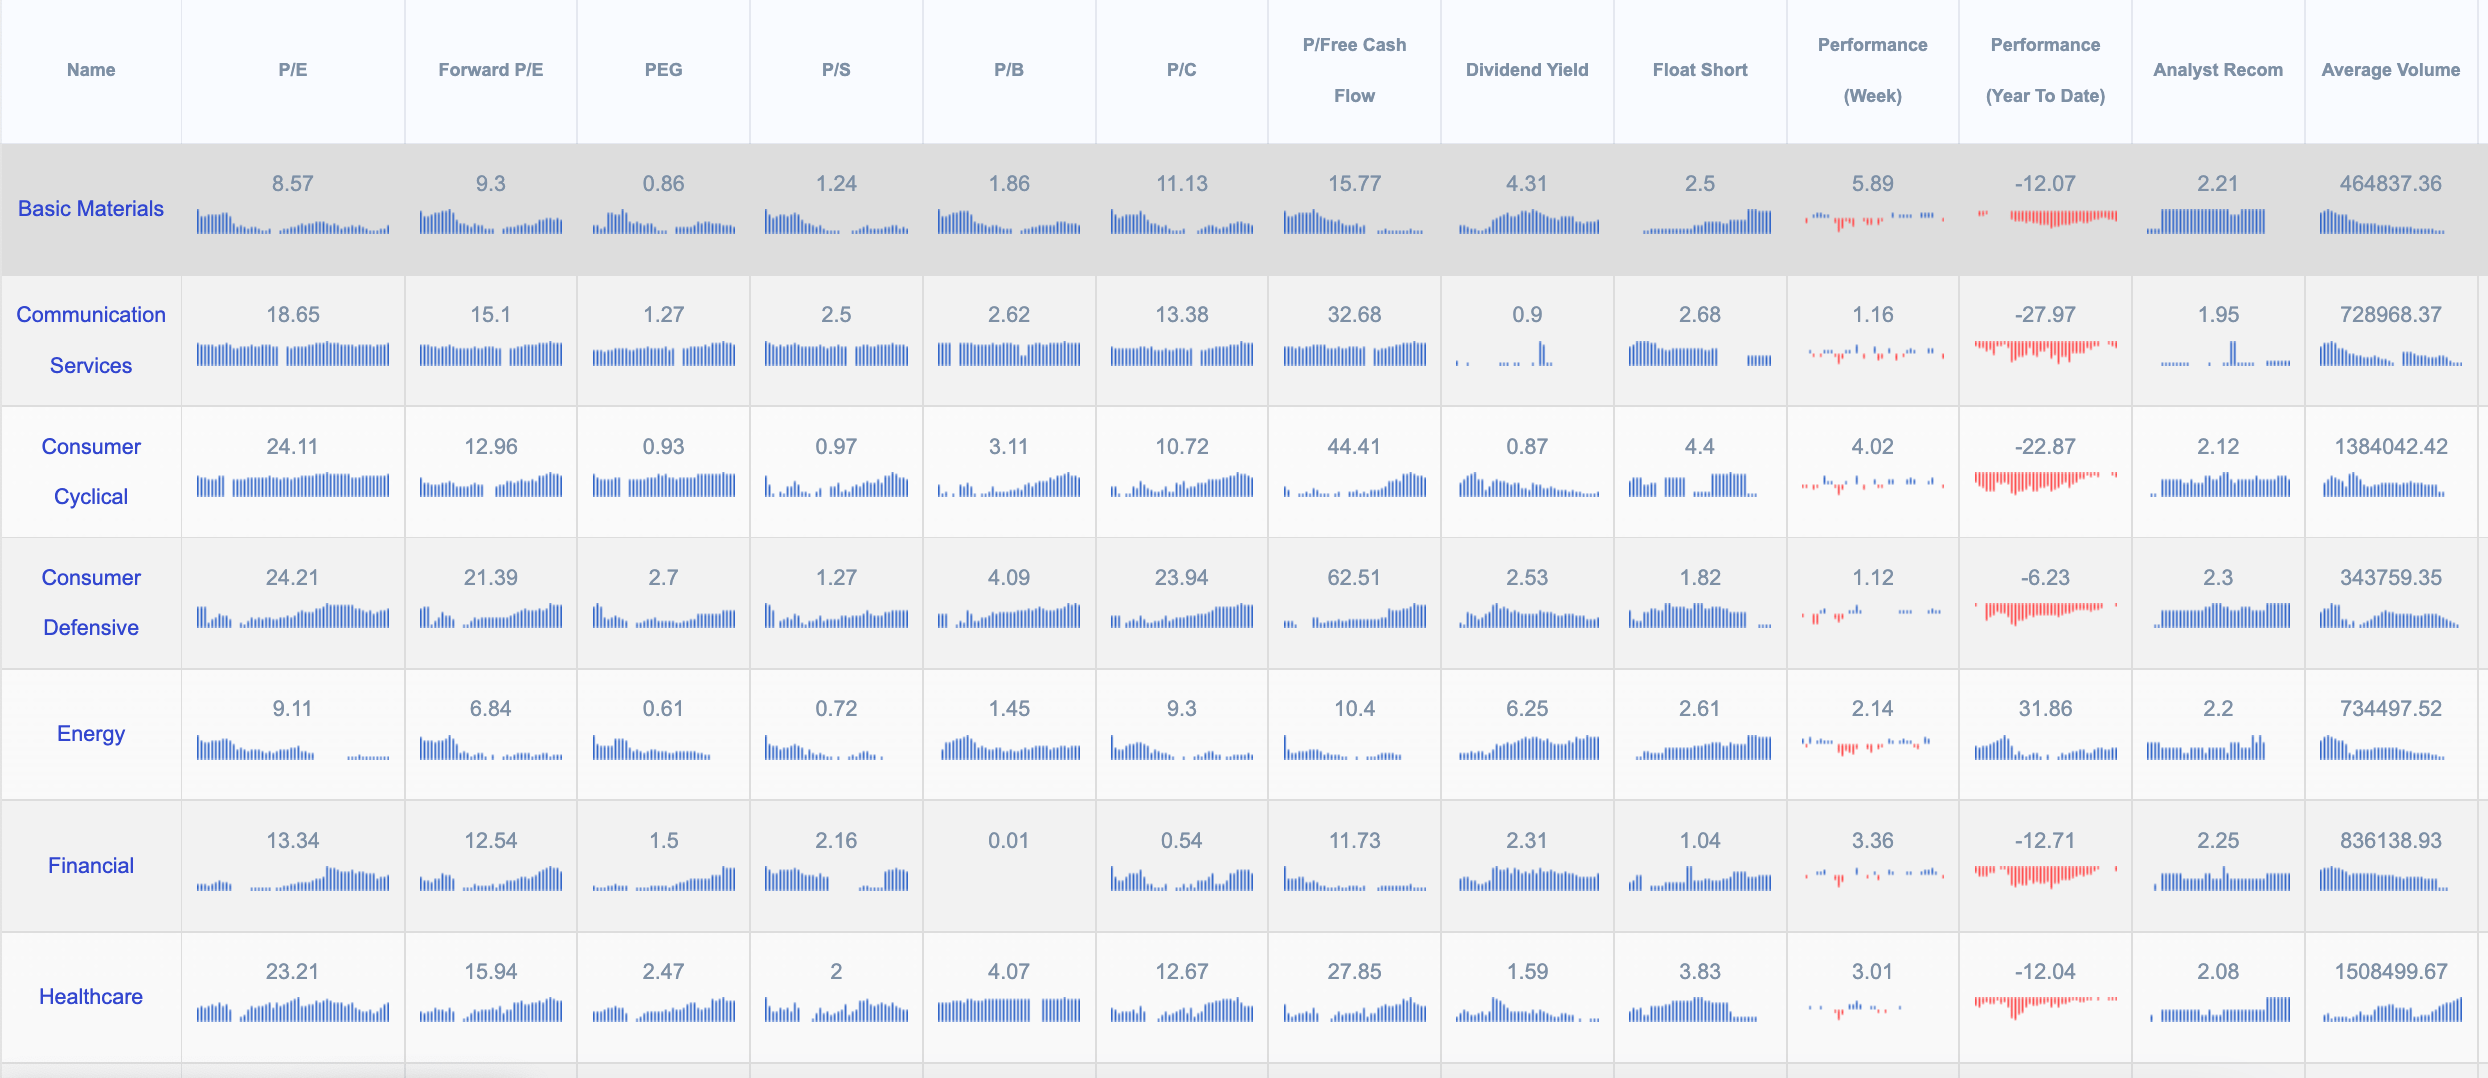
You can track important performance ratios such as P/E, Forward P/E, PEG, P/S ,P/B, P/C ,P/Free Cash Flow, Dividend Yield, Float Short, and analyst estimates.
How it works : The visible number in the table and the last column to the right of the chart represent the last value ( which is updated at the end of the day) the values represent an average of the values of the stocks quoted on the NYSE.
With this tool you can track the trend of a sector, industry, country, you can easily search for the best opportunities and better understand the market dynamics, this tool can also be used in the screener on our site, for the search of stocks.
The weekly version of the tool works with the same principle; the difference lies in the fact that the weekly one is updated every Friday, and each bar represents a week.
You can use this version if you want to have a longer time overview than the daily one.
We always invite you to visit our glossary in case you cannot understand the elements that make up this tool you can find it here.
Smart Money Tracker is a tool that you can find in every Stock ETF and Futures ( for the Futures is shown ETF that replicates the trend of the asset).
The aim is to track changes in estimates , in the fundamental data or the progress of the action you will have 100 different types of data to analyze and do studies.
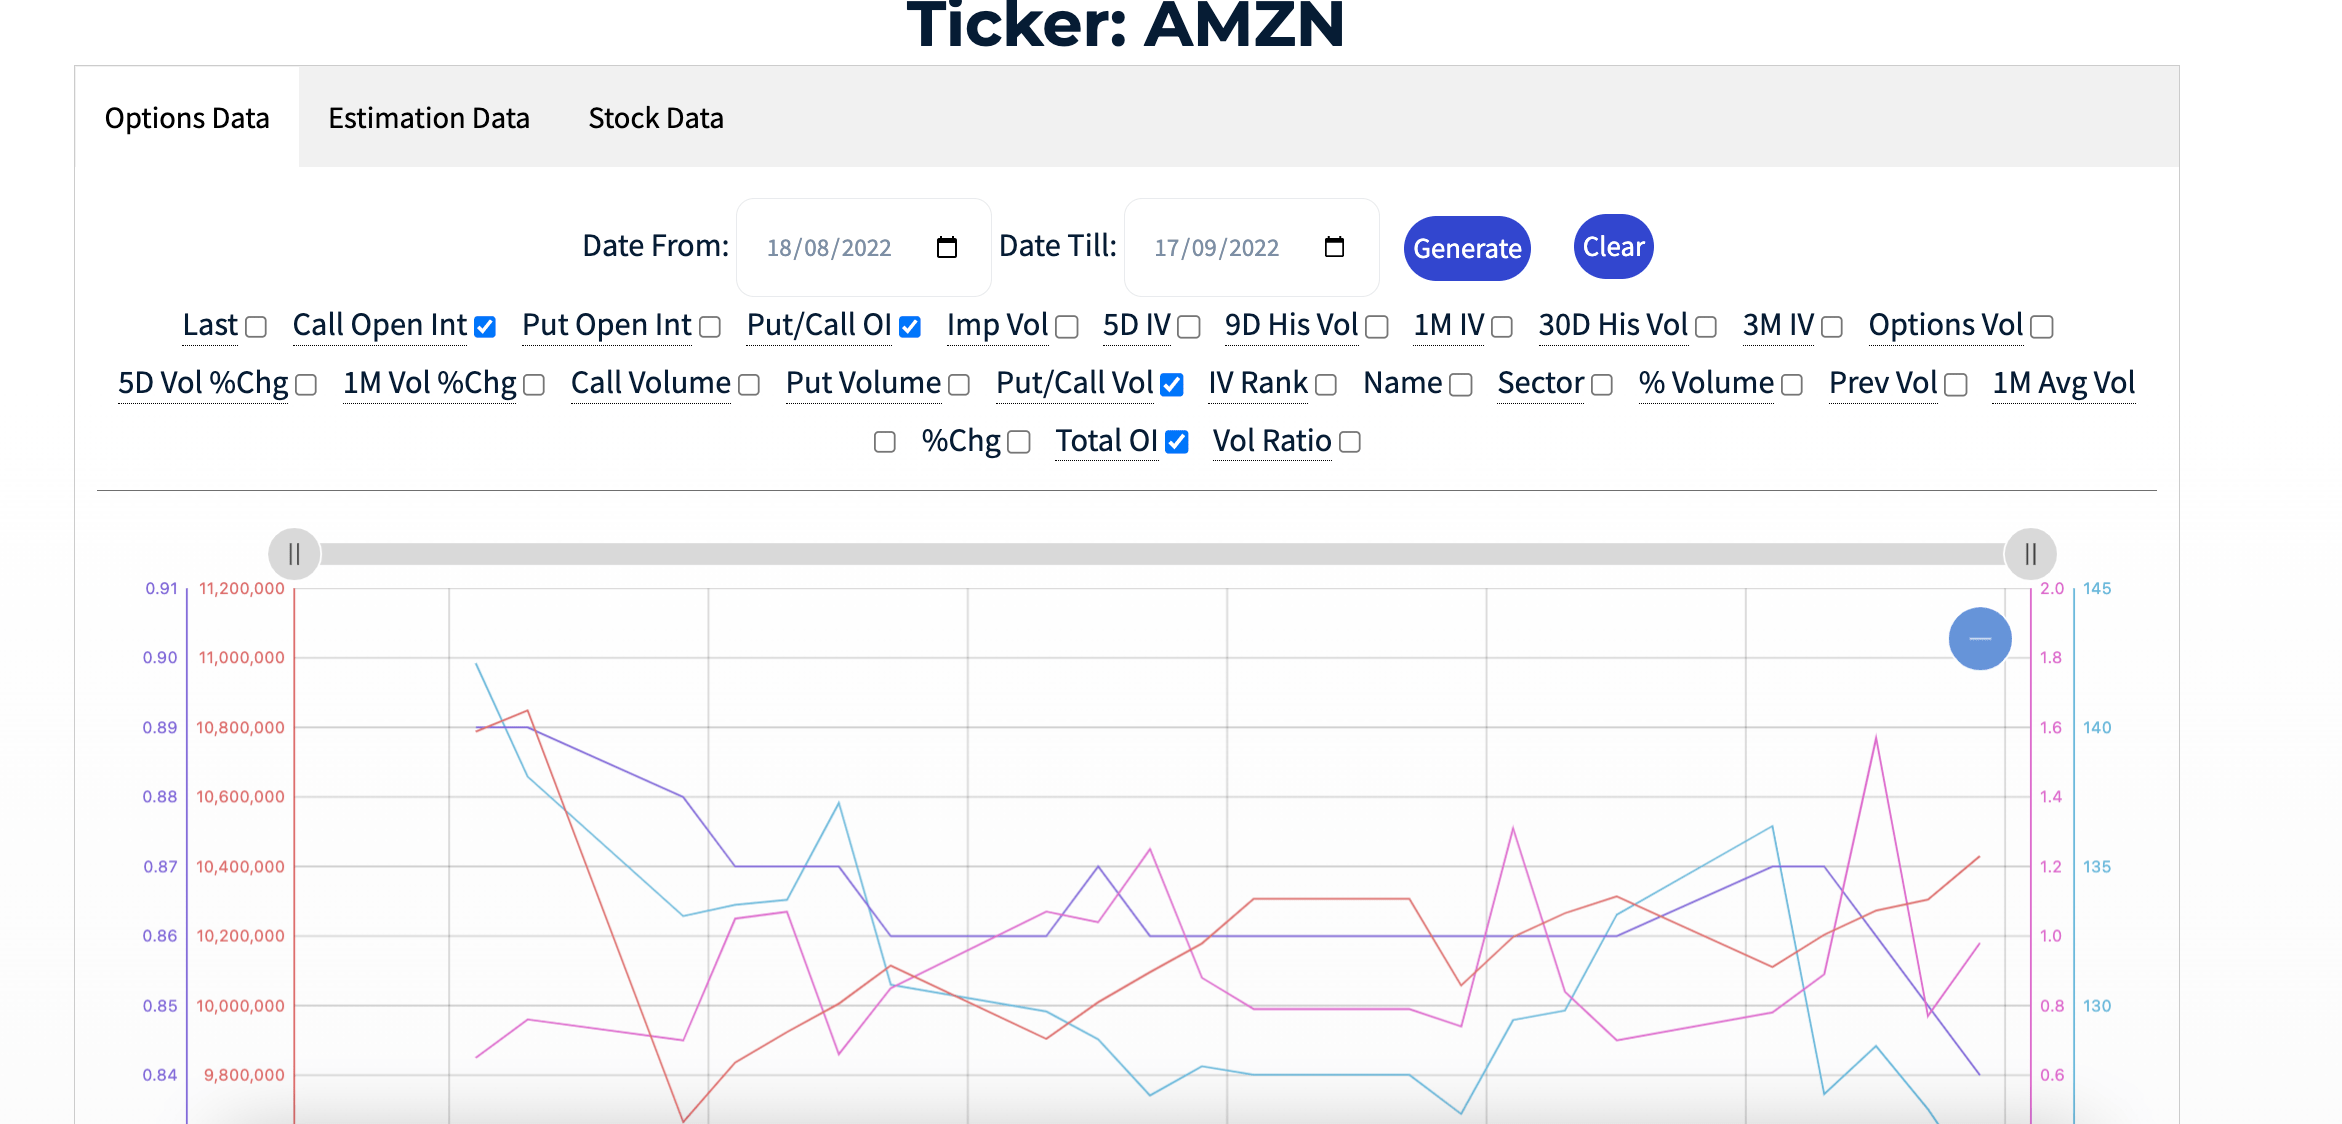
It is divided into 3 sessions, Options data where you can track elements such as Open interest, volatility , volume and more related to options , tools typically used by smart money to make transactions on the market.
The second part , Estimation Data ,is focused on analyst estimates regarding EPS, Sales , EBIT , Fair Value etc.
The third part , Stock Data, is more specific for investing, there you can find all the most famous ratios used to analyze a stock such as P/E , P/B , P/Free Cash Flow Ect, also in this section you can check the movements of insiders and institutional as well as the Float Short .
How to use it:
For each section, default lines are shown, representing basic studies on open interest , analyst estimates and float short.
You can change data by ticking the ones you want and clicking generate or remove them by clicking clear.
Each line has a different color and axis and represents a given.
You can also trace data from the table below the chart.
The period shown by the default chart is one month you can change the period in the appropriate form, the data starts from March/April 2022
IF YOU WANT MORE INFORMATION ON THE OPERATION OF EACH ITEM ON THE SMART MONEY TRACKER YOU CAN USE THE GUIDE/GLOSSARY THAT WE HAVE AVAILABLE HERE.
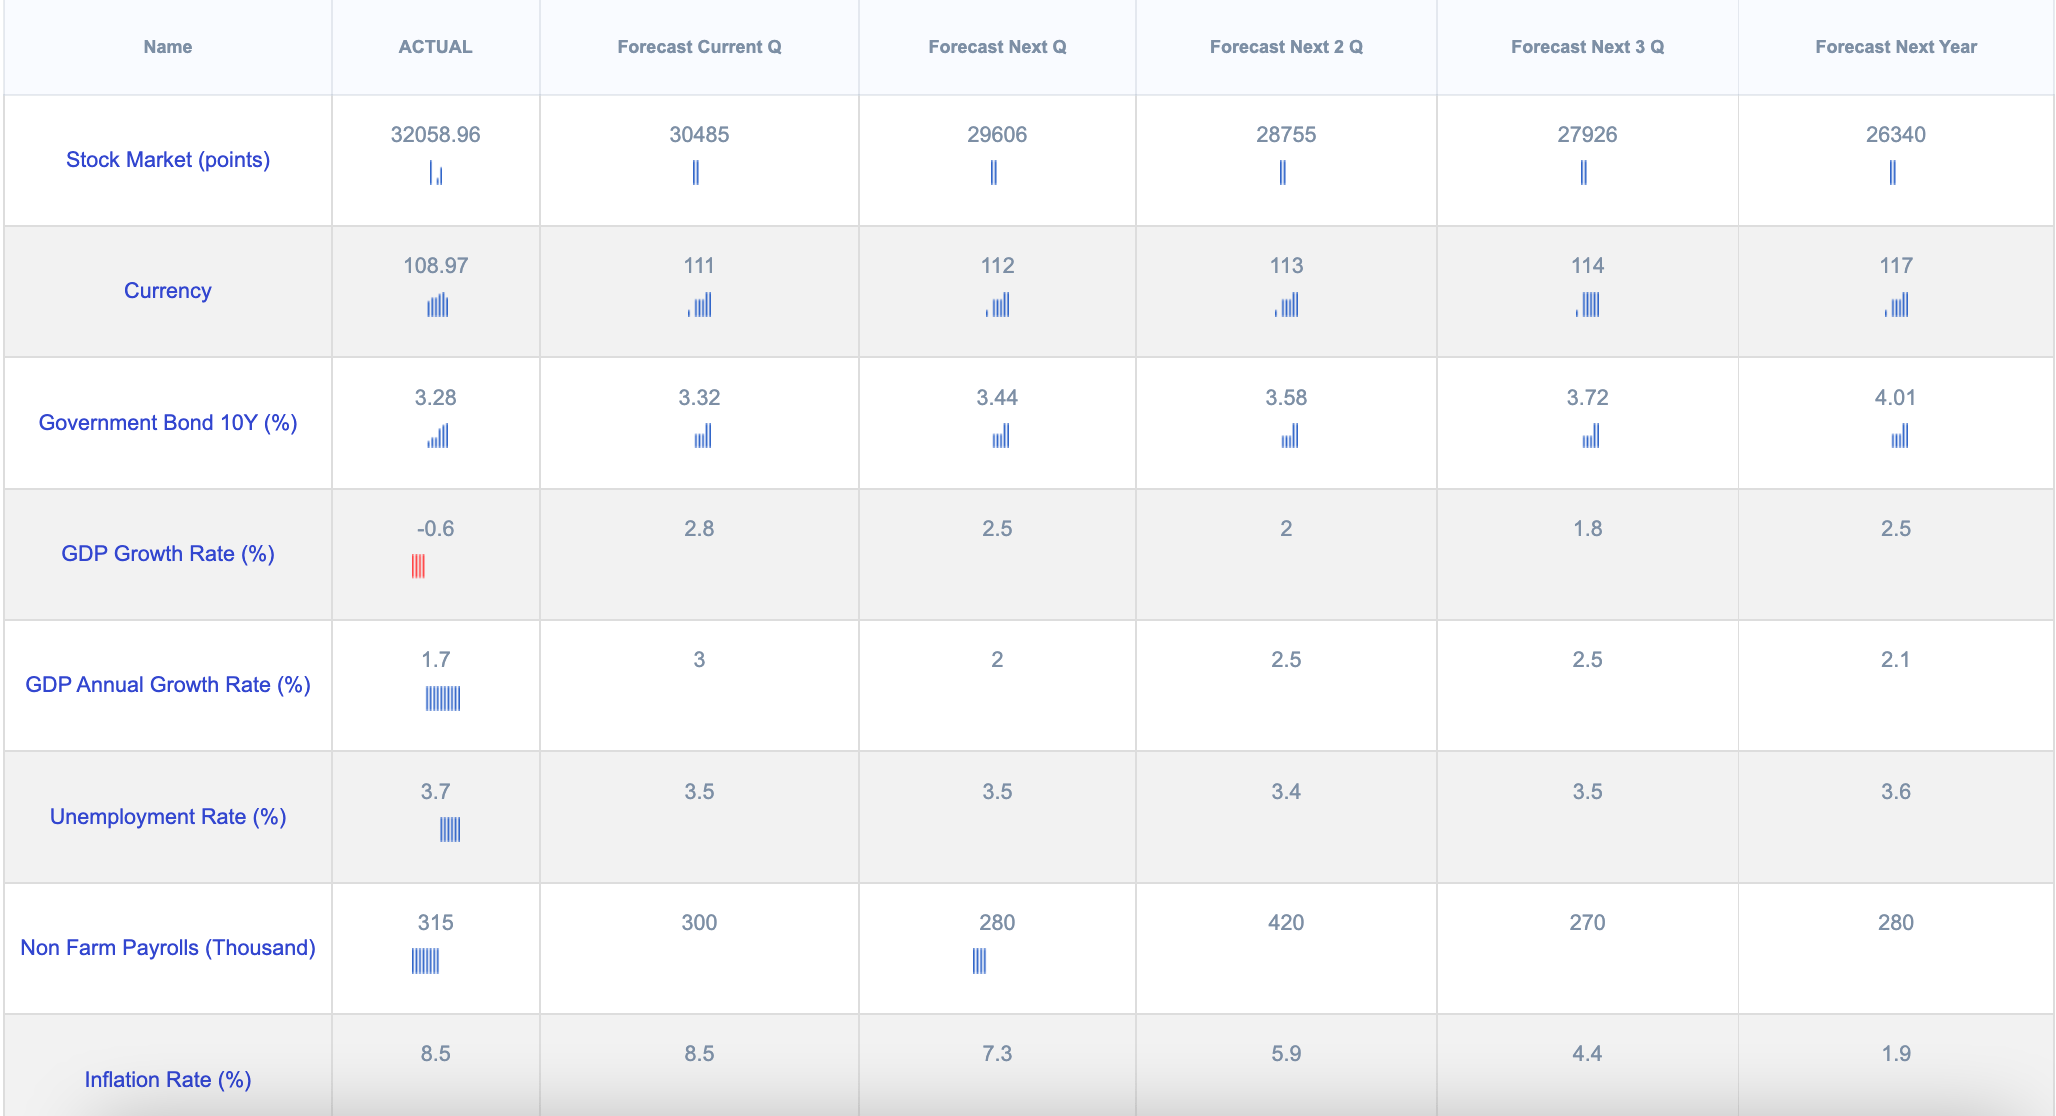
With this tool you can track the trend of over 150 US macroeconomic indicators with a single click.
How it works :
The first column (ACTUAL) shows the actual releases of the data, the number exposed in this column and the last bar of the chart show the data of the last release while the previous bars of the chart show the previous releases, typically ( but not for all indicators) are released once a month.
REMEMBER that only the first column ACTUAL proposes government data releases while the next 5 columns are estimates.
Forecast Current Q Forecast Next Q Forecast Next 2 Q Forecast Next 3 Q Forecast Next Year , concern the estimates made by analysts about the current season, the next three and next year.
The number shown in the columns and the last bar on the right show the last estimate made by the analysts, while the previous bars show the estimates made in the past.
This tool can be used to check the trend of macroeconomic estimates and indicators, for example, if the estimates on house building permits or mortgage applications improve we can use this information to invest in real estate.
The data is updated every Wednesday and every Friday except release of important data on other days of the week.
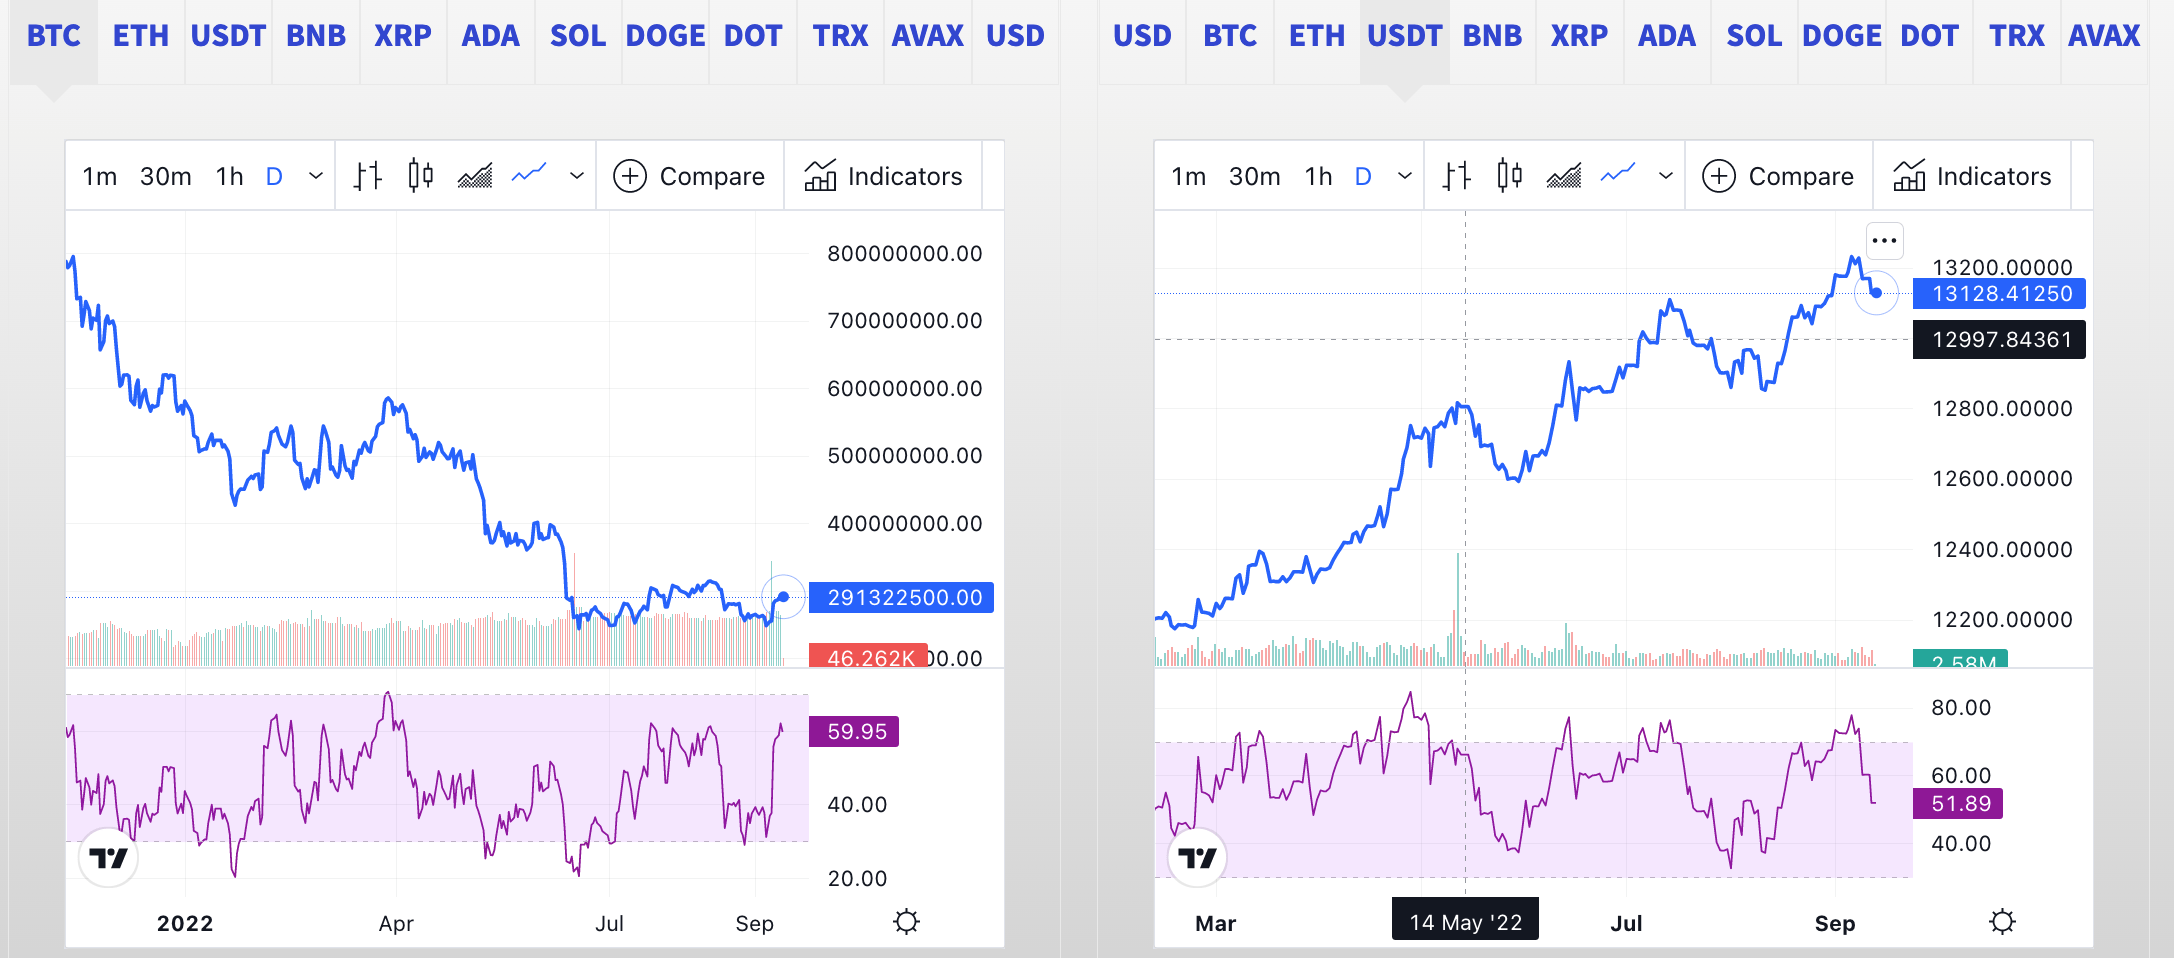
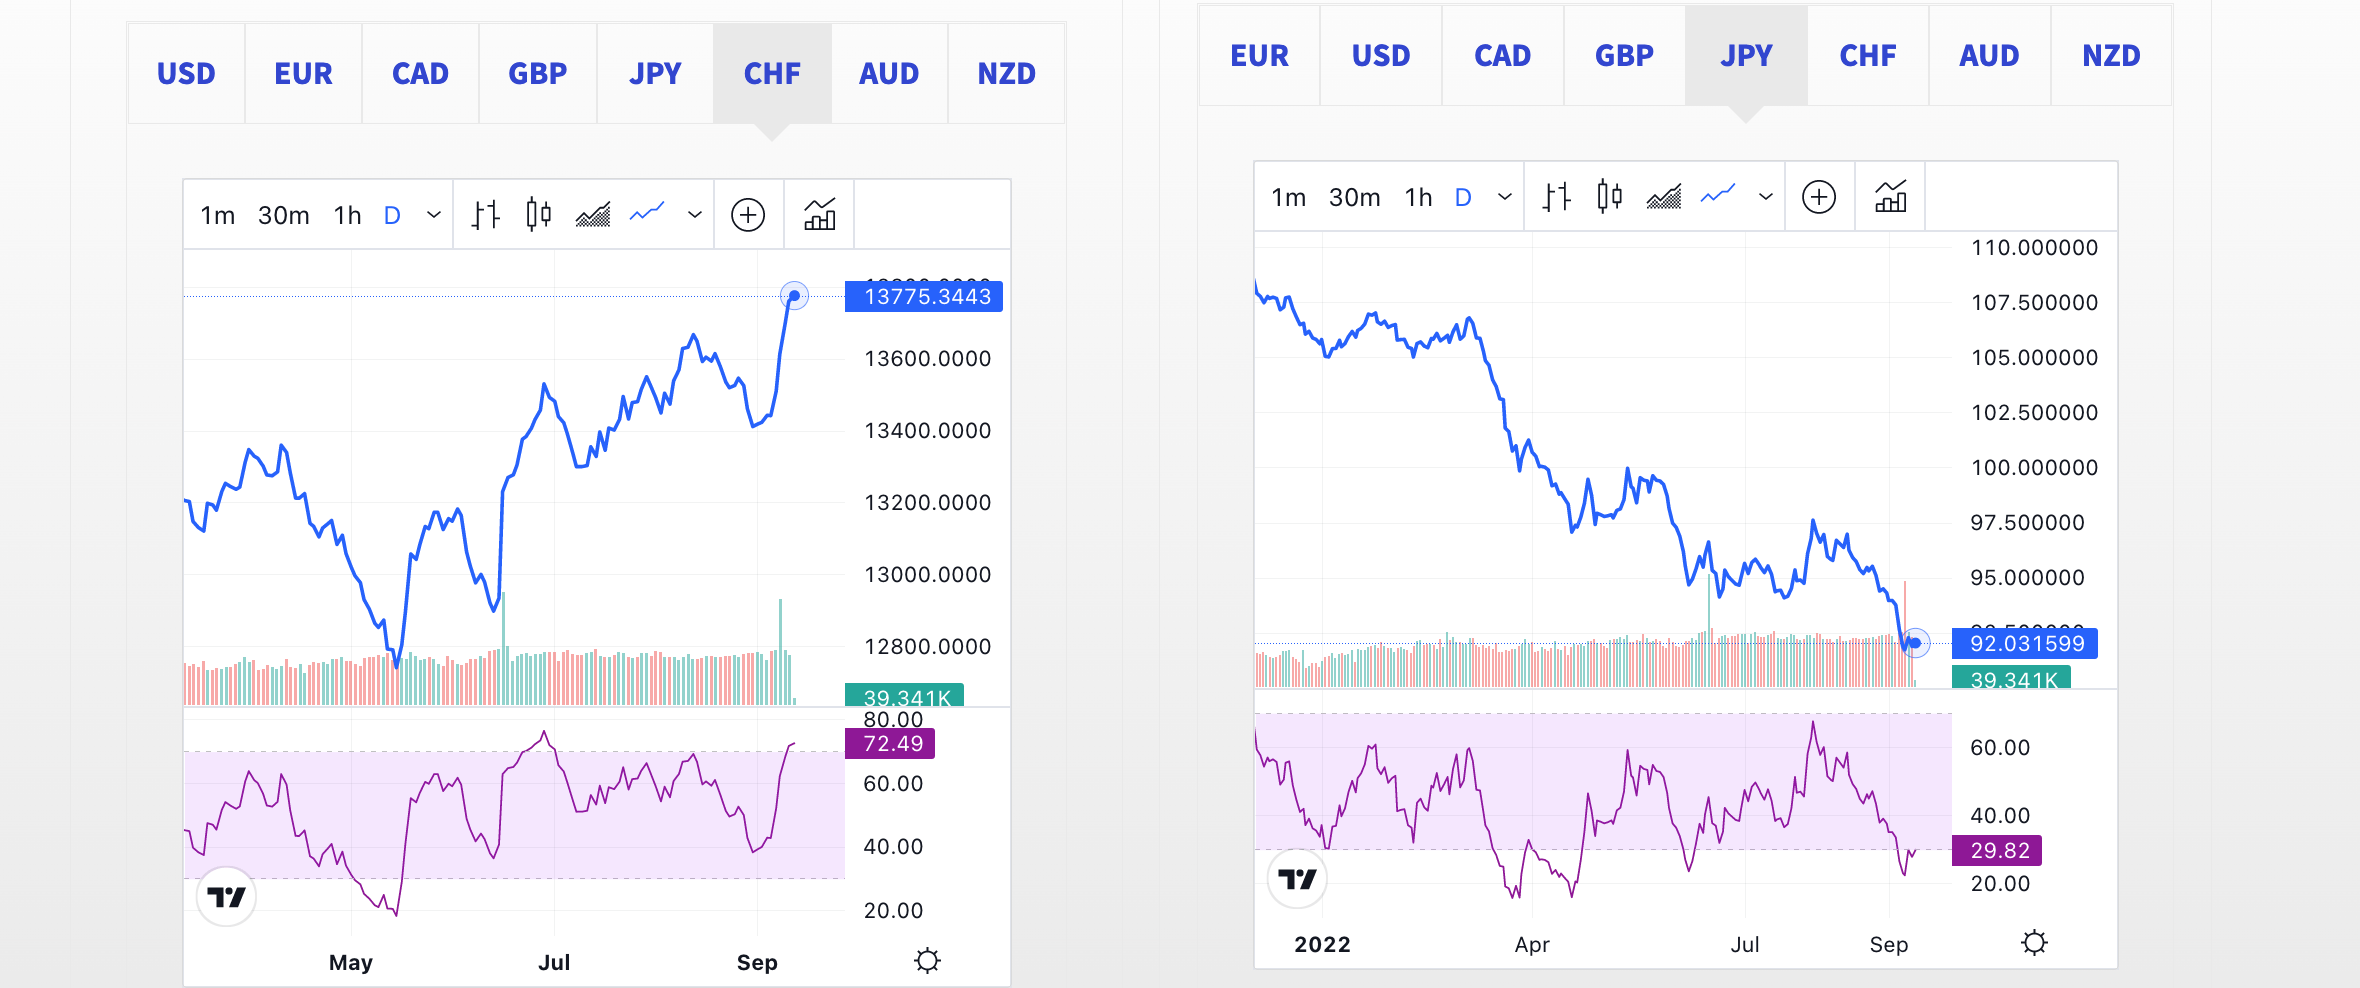
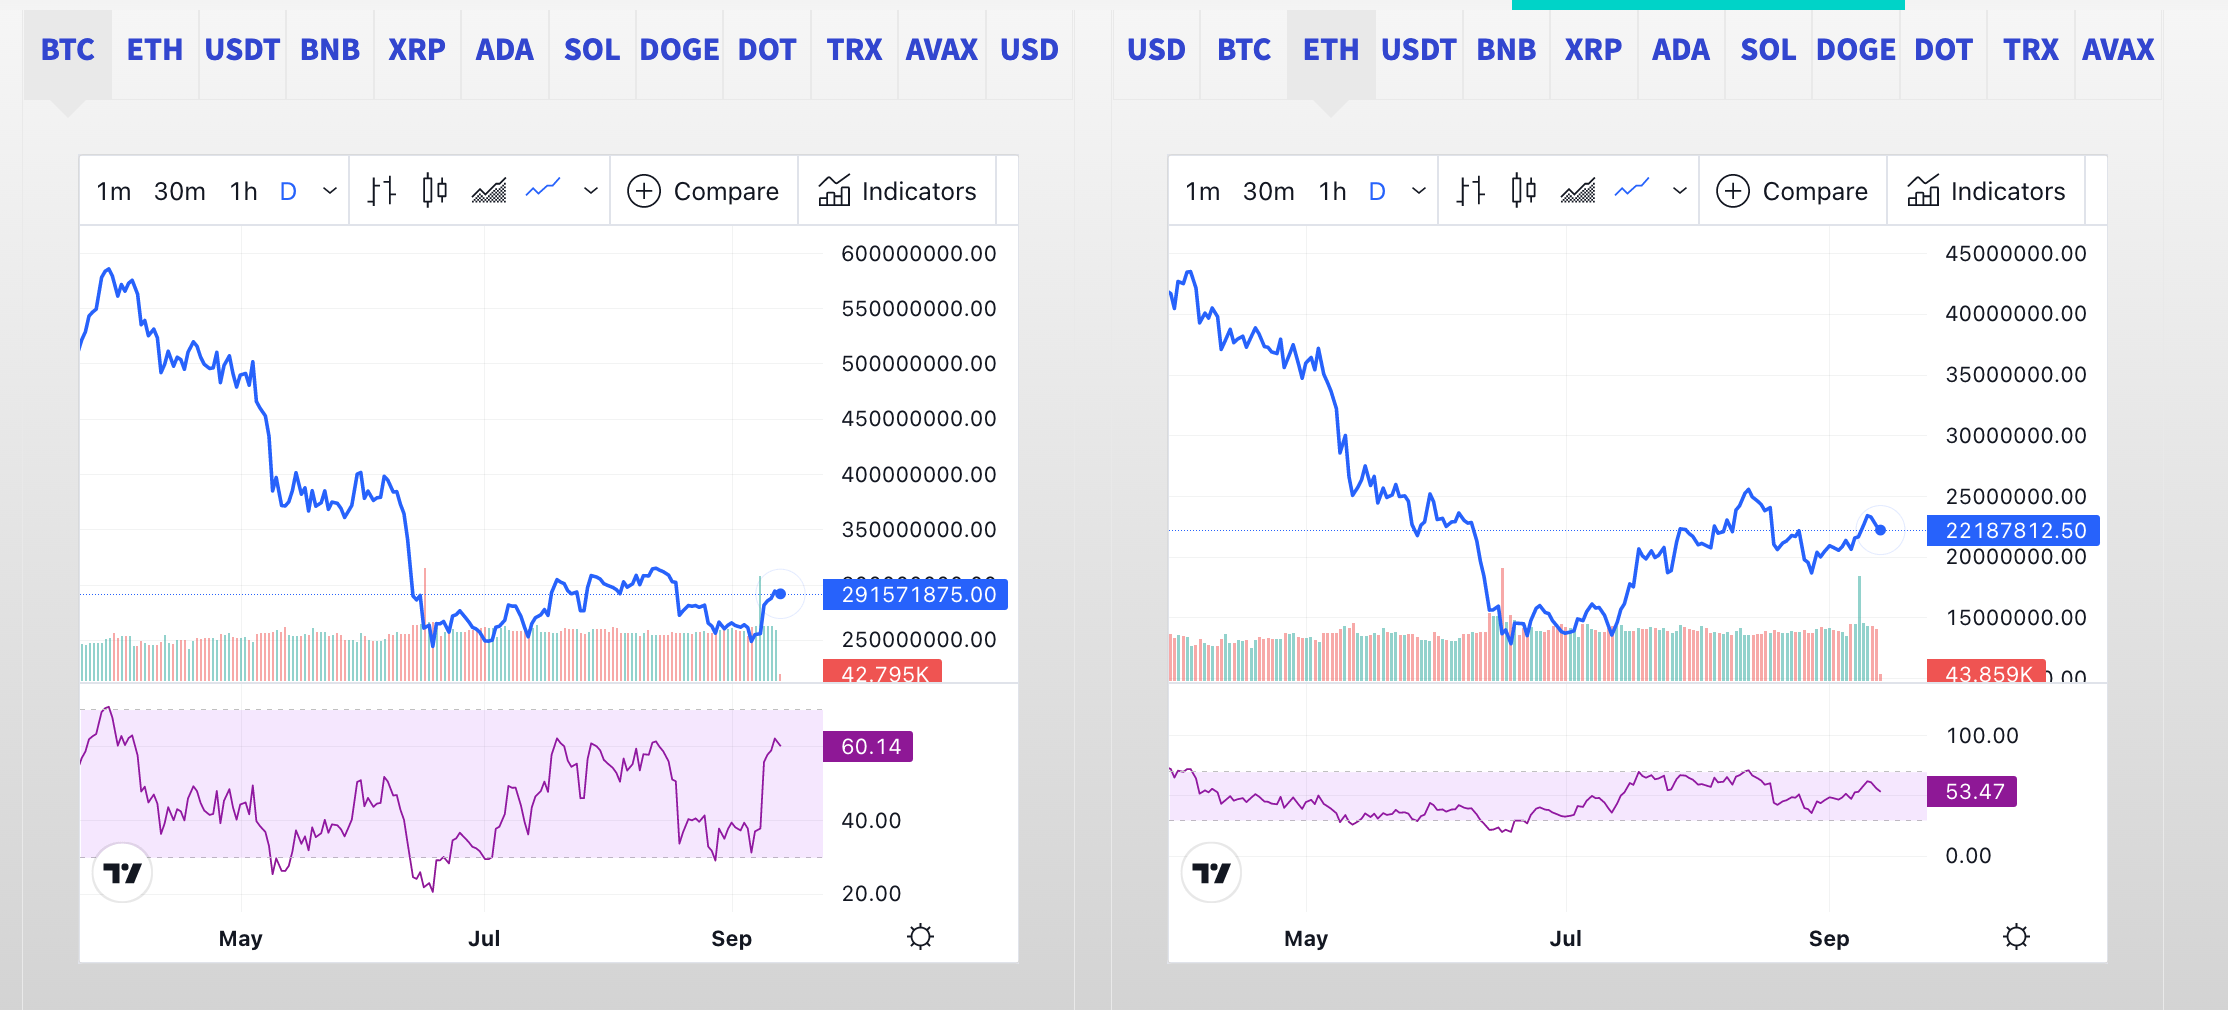
Many traders do not realize that when they are trading Forex or Crypto are trading a ratio between two absolute values, when we betray Euro Dollar or Bitcoin Dollar we have to consider not only the chart but the strength of the individual currencies, This is why our tool will help you understand the dynamics of Forex and Crypto, as it calculates the strength of individual currencies and comparing them you can make the most of trading on these below.
How to use it:
in the tool are reported two charts each chart represents a currency or a crypto, the goal is to find currencies that individually have different trends if you want to operate in trend following or long-term strategies , similar trends or laterizations to employ mean reverting strategies.
To facilitate we can use the RSI indicator (Relative Strenght Index) present in each chart to easily identify the strength of the currency.
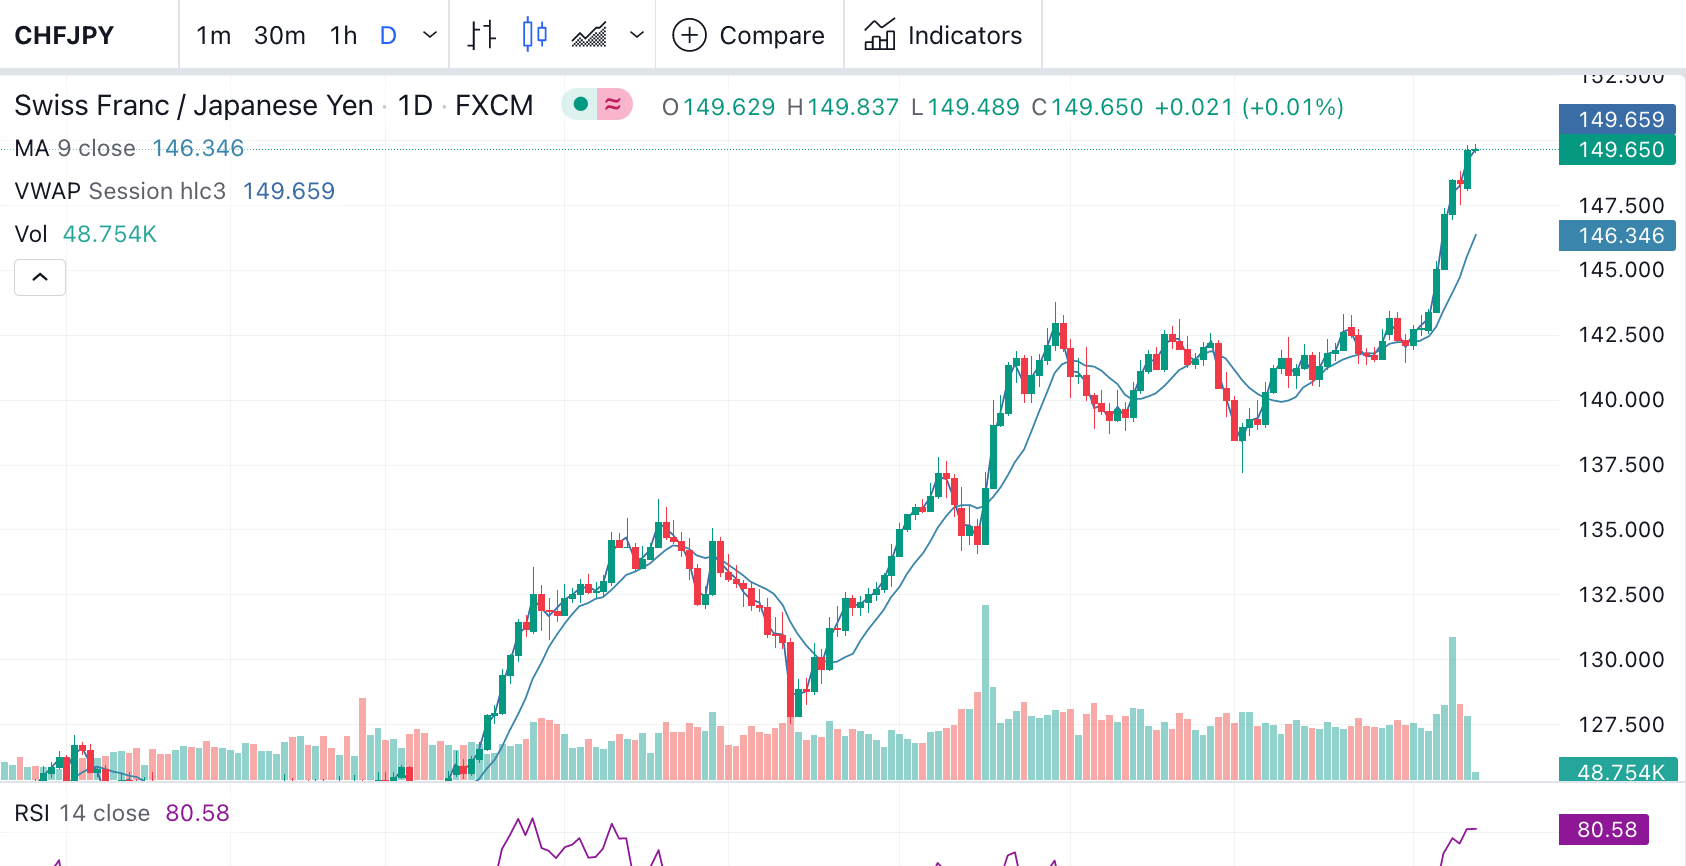
Example 1)
We want to find a strong trend , then we browse the various currencies and see that CHF is the strongest while JPY is the weakest , the result of the chart is a strong bullish trend , Knowing this information we know that by buying the Swiss franc we would have a greater return selling the Yen than with other currencies.
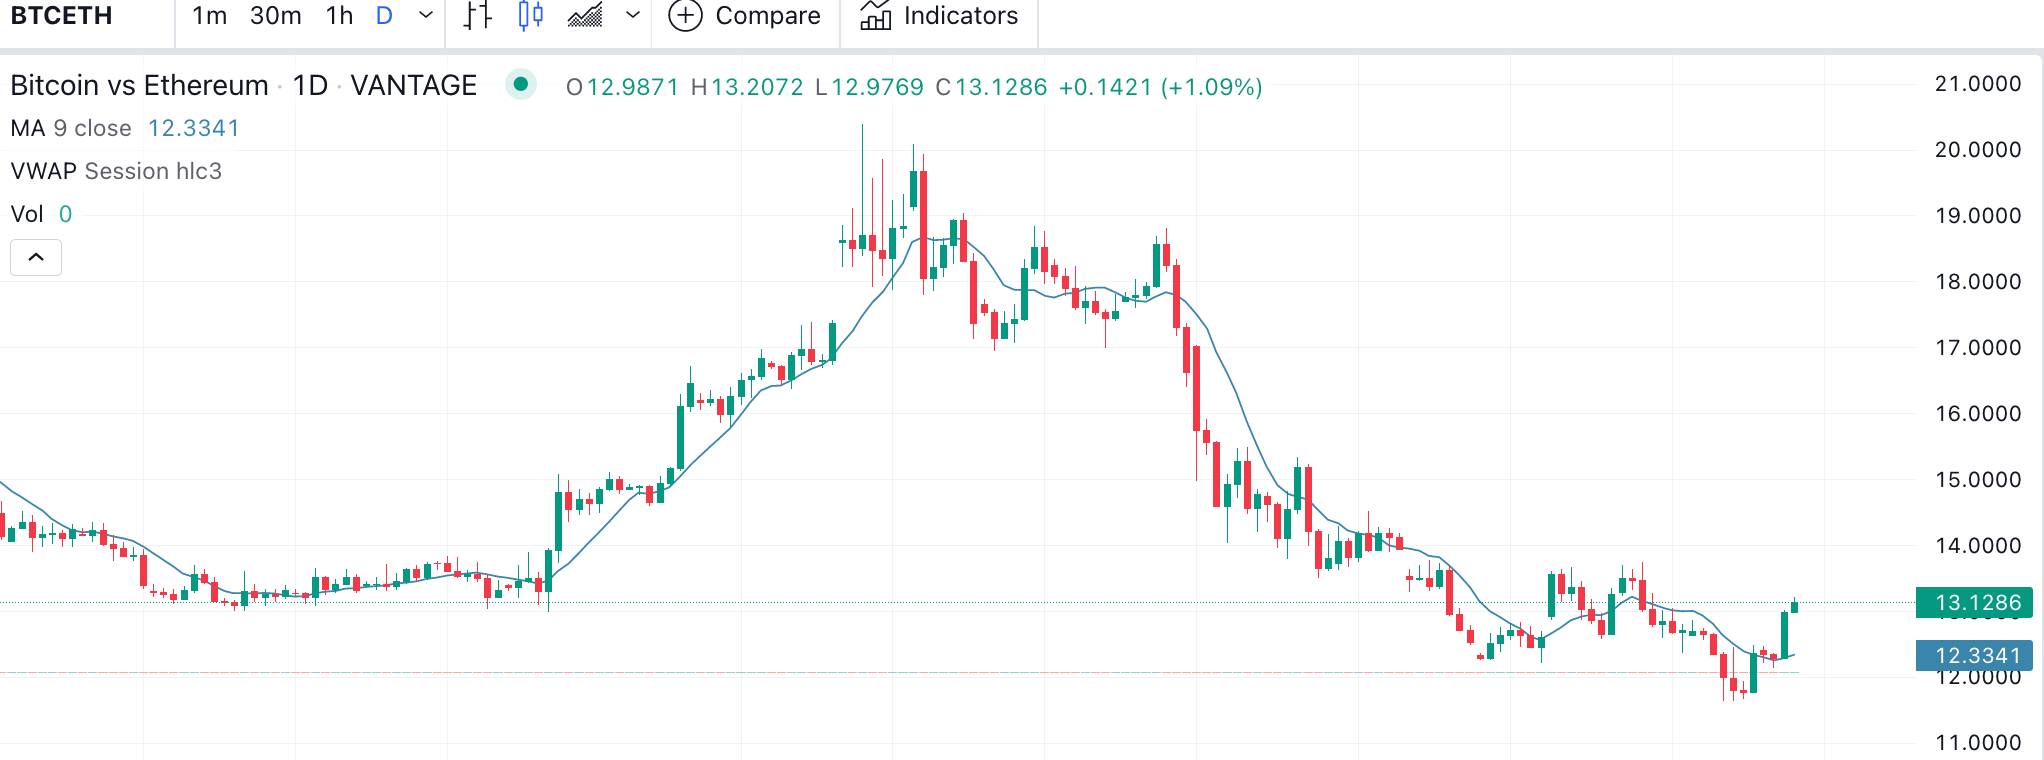
Example 2)
We want to find in lateralizing market or a trend reversal, Analyzing BTCETH we note that after a small trend of Ethereum realignment both cross are currently stabilized we could use strategies of meann reverting or monitor the situation and wait for the trend iversion if Bitcoin performs better than Ethereum .
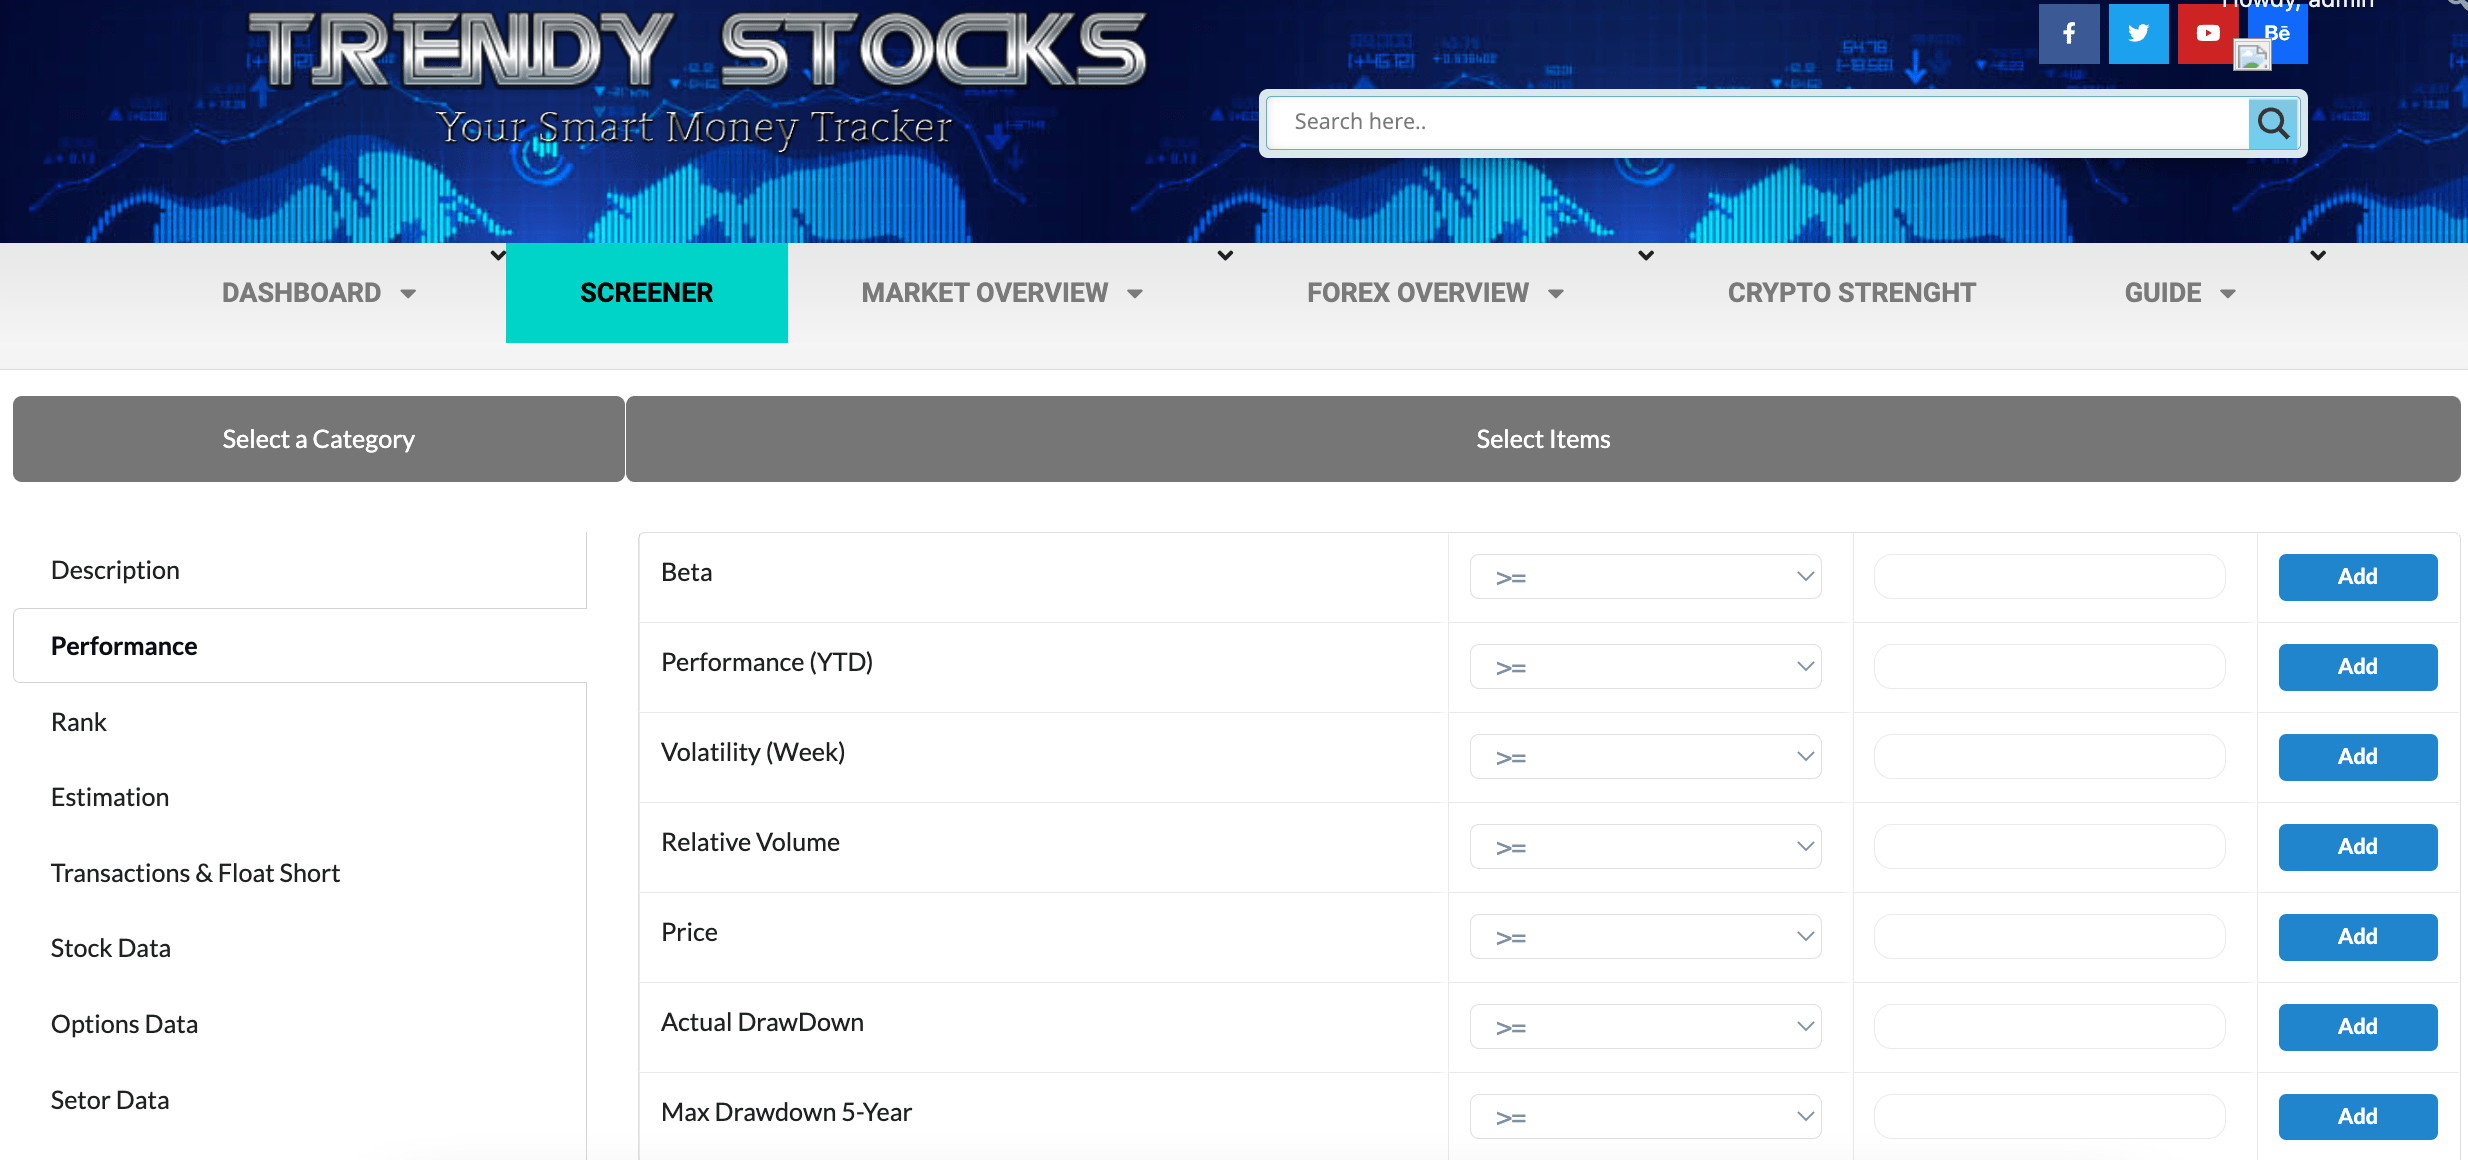
Our screener is undoubtedly one of the most powerful and complete on the web.
As with the Smart Money Tacker here too you can choose and combine almost 100 indicators, among those of options , fundamental , analyst estimates etc. You can use them individually or combine them to get confirmation from multiple fronts.
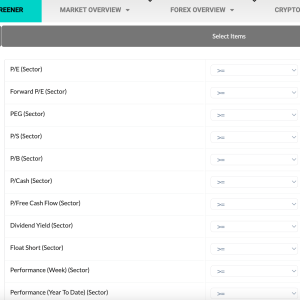
As you see it is very intuitive , just choose the parameter you want to use and choose if you want it greater equal > , smaller < , equal = or different <> from a value you choose, and press the add key , Once you have chosen all the filters you want you can click on Run Screen and you will see the companies that respect your parameters.
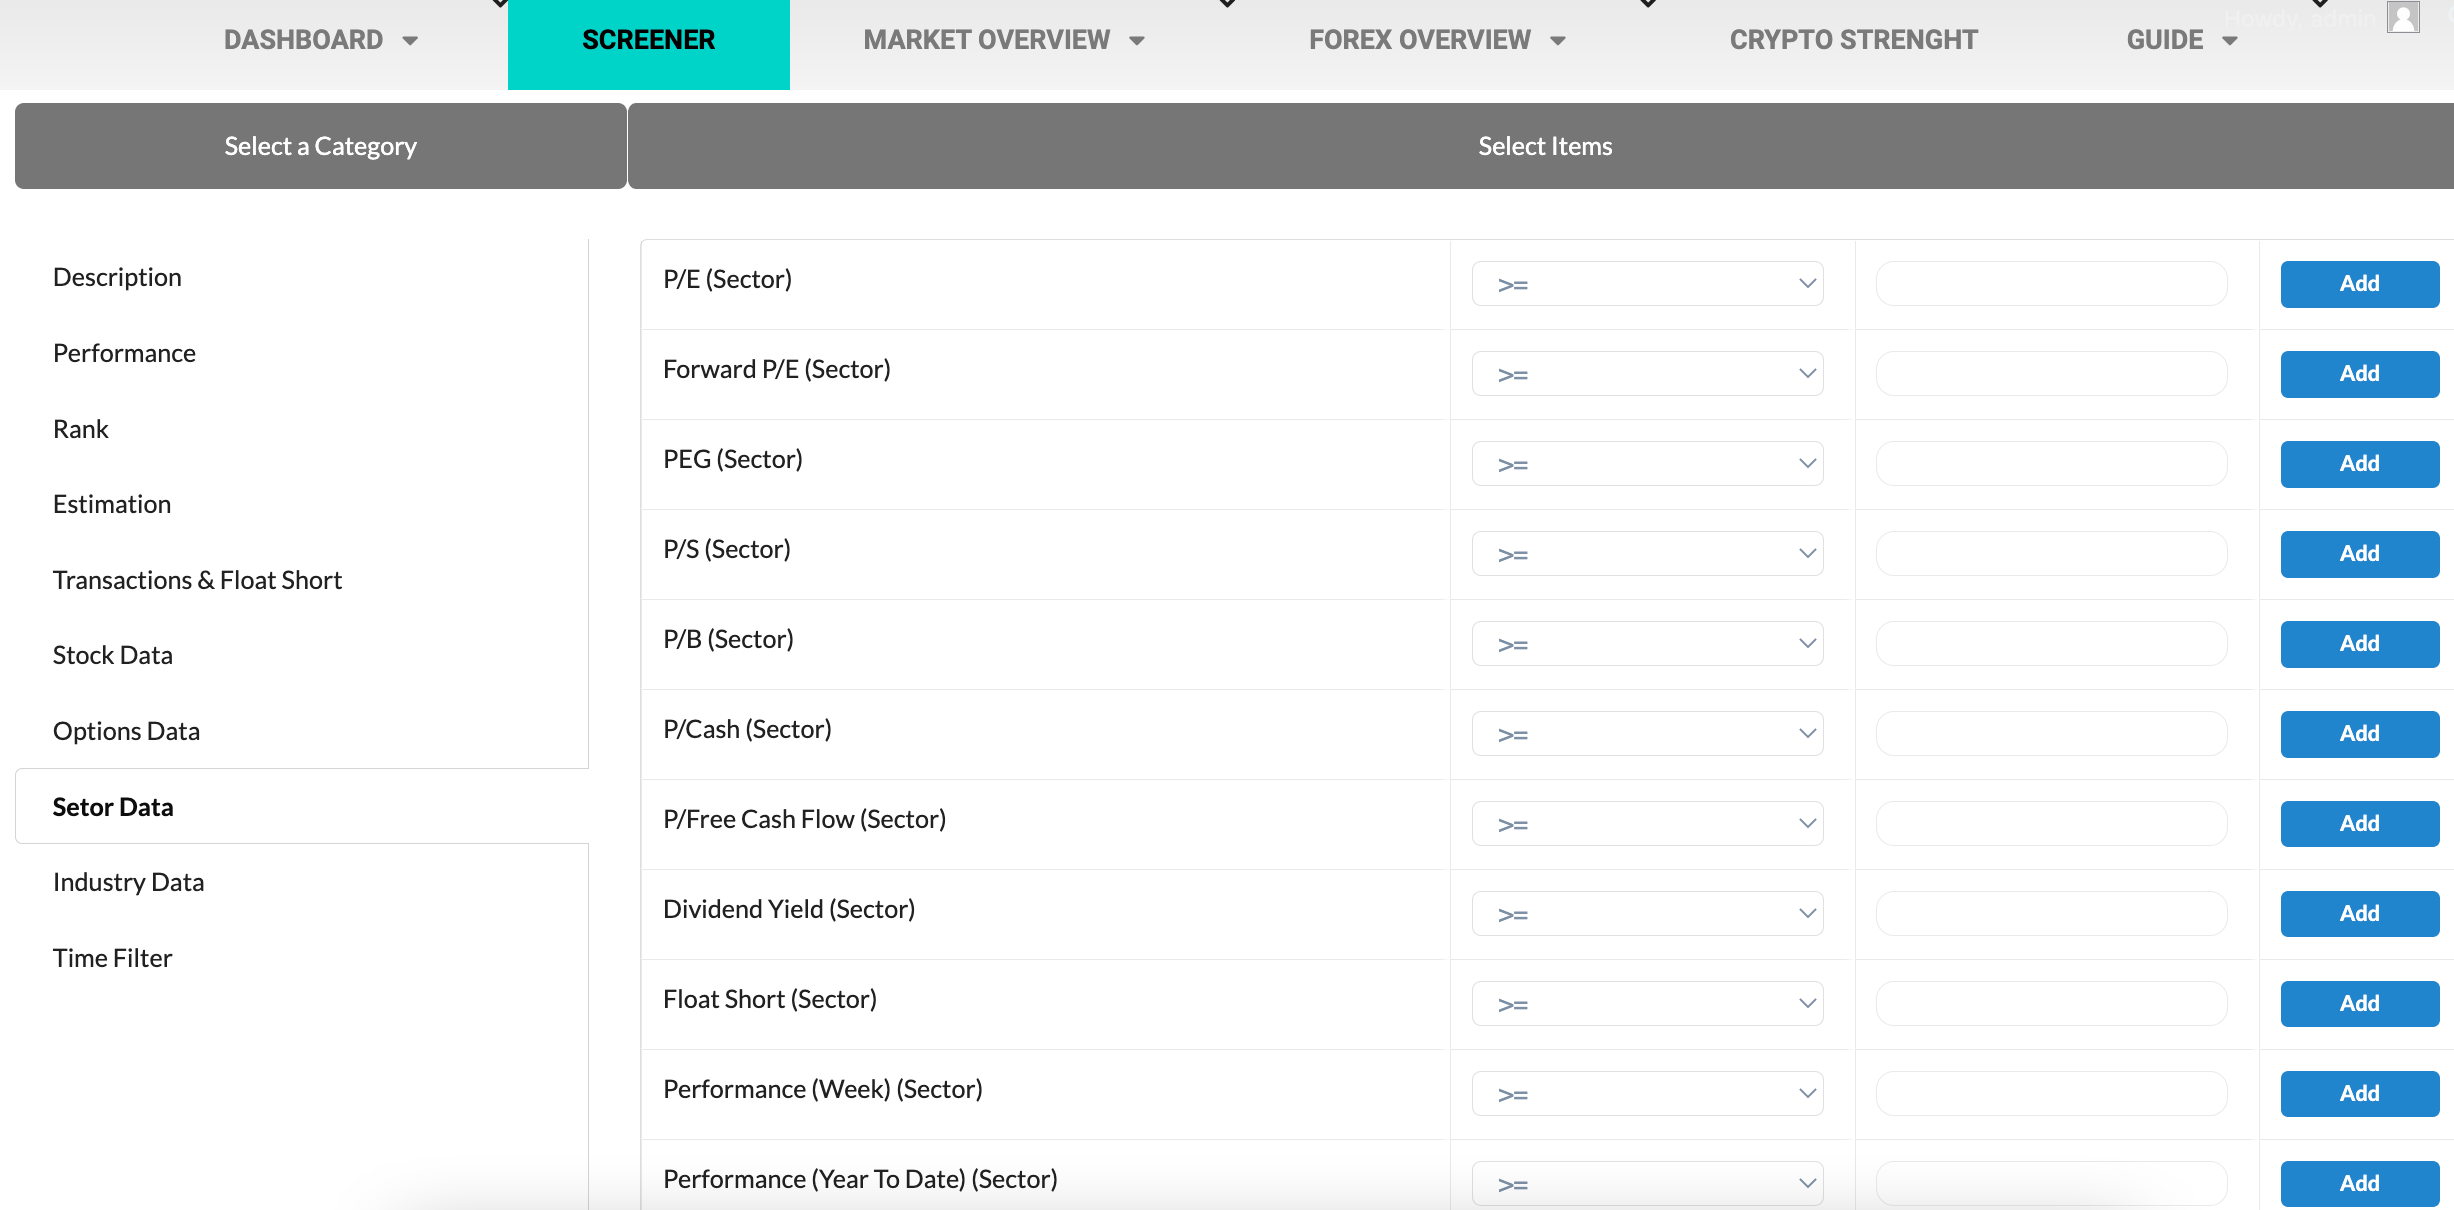
Now let’s talk about the two special filters that make our screener unique.
In the Sector data and Industry data sections you can filter companies only from sectors or industries that meet your parameters, for example you can filter companies that are in sectors that have a low float short , or have had positive performance or are recommended by analysts.
Then you can filter sectors and industries with two clicks without first analyzing or searching for the company you are interested in.
Making trades in the right industries and sectors will greatly increase the chances of profit.
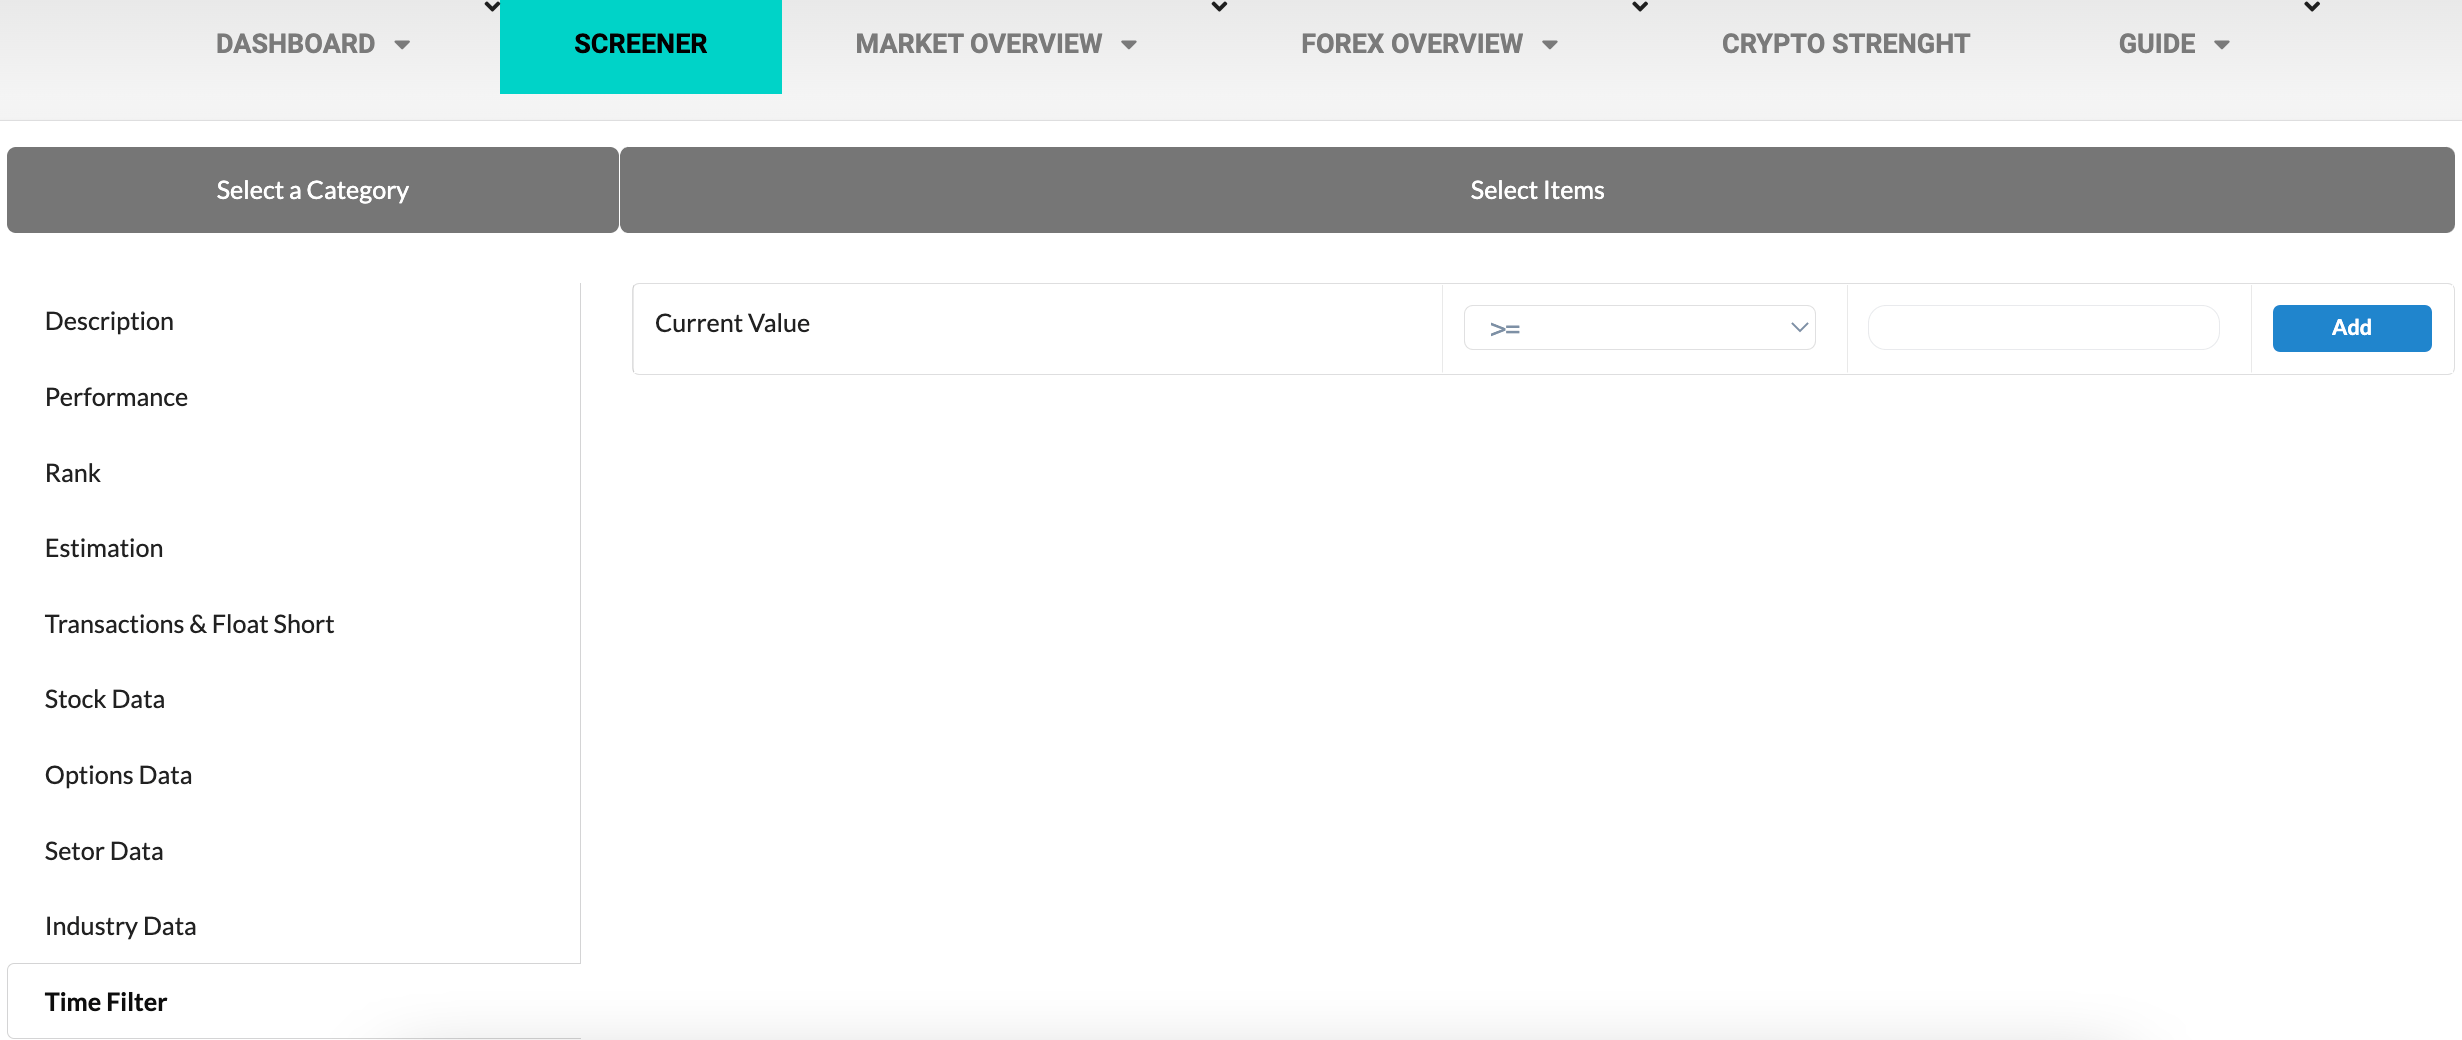
Second filter is the time filter you can find in the last section of the screener.
All the sceeners on the market allow you to find companies that have a certain value but if you want to know if that data is improving or worsening how can you do it?
For example to find stocks to low price but where the fundamental ones are improving so as to find the bottom of the trend, now you can do it.
How it works:
Select as many filters as you want from the other sections ( you can also assign neutral values using the filter <> from 0 , so you will not specify particular values but will find only companies that are improving or worsening)
Once chosen go to the Time Filter section, the filter takes the current value as a reference, or the last data present selects whether the current data must be greater than the same or different than a date you want.
in the last column of values enter the number of past days you want to compare current value with, then if you want to compare the current value with the 10 days ago just enter the value 10.
Let’s take an example to better understand:
We want to find companies with a price higher than 10$ that have increased in value in the last 3 days and that this increase is supported by the growing open interest.
We go to the performance section and select Price > 10 then go to the Options data section , we find Total Oi, in this case we do not care that it has a specific value but only that it is growing so we insert the filter <> from 0 .
Once this is done go to the Time filter and select that the Current Value must be greater > than 3 days ago then enter the value 3.
Added all filters click on Run Screen and you will see all stocks that have a growing price and open interest in the last 3 days.
To discover the elements that make up the screener I invite you to visit our glossary by clicking here.
Case Of Study Apple Inc:
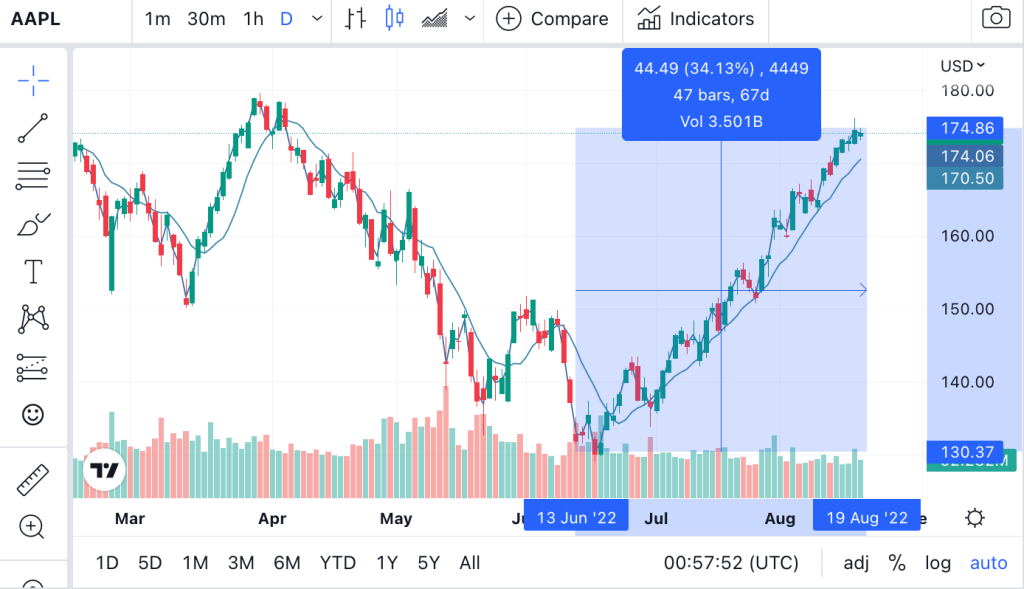
The stock came from a bearish scenario due to the rise in rates by the Federal Reserve and high inflation scenarios; at some point the price reversed and a fast bull run began that made almost 34% allowing us to get close to the historical highs.
Let’s see how to use our tool and how we could identify this new trend before it exploded.
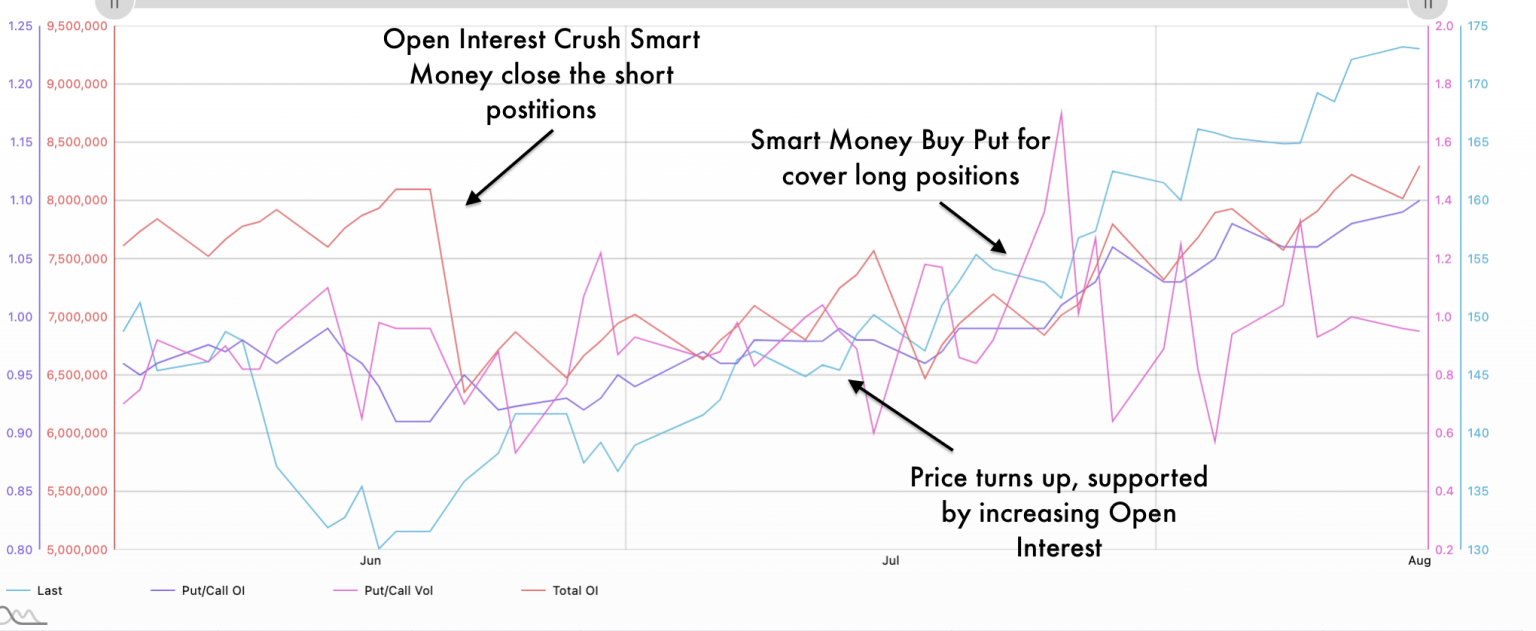
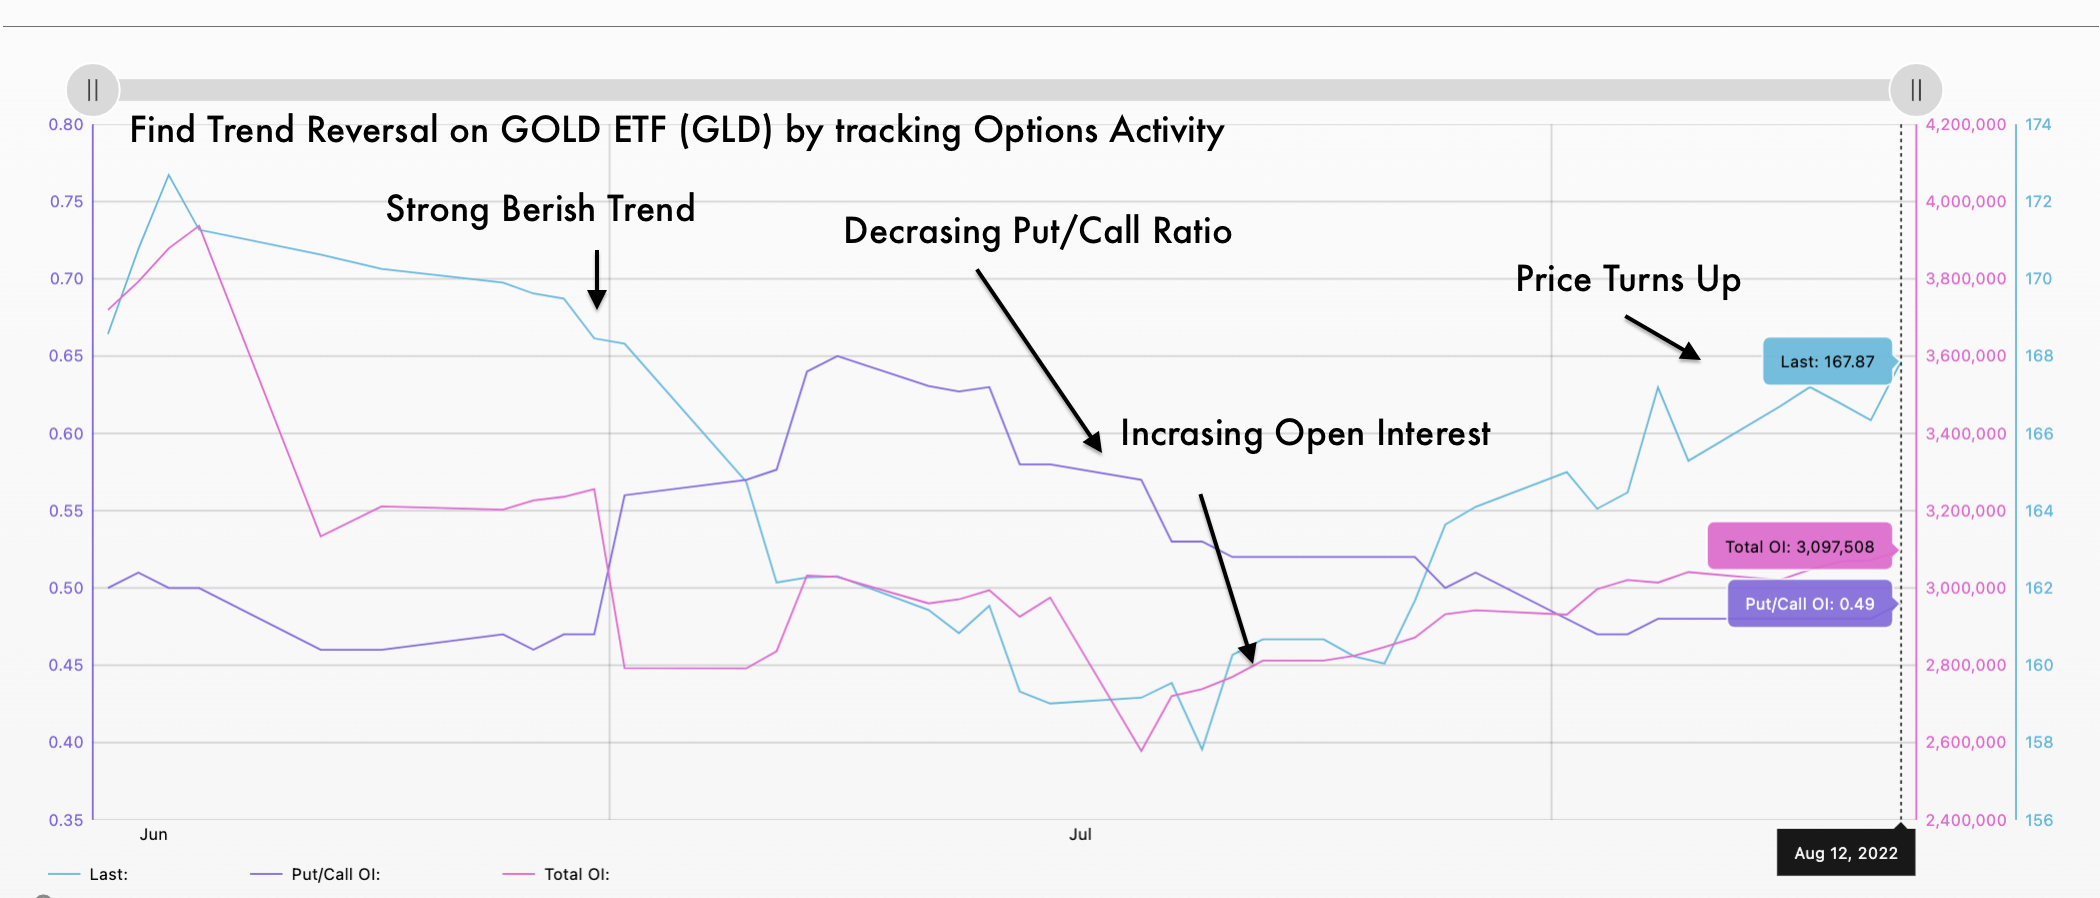
Using the motion of the options we want to know if we can understand the moves of the big whales. This tool can also be used by those who are not experts in options. Smart Money when buying stocks usually cover and protect their options by buying put options, to simplify buy an insurance that in case the price goes against them can exercise at a certain deadline so as to reduce or eliminate losses due to a wrong trade. Open interest is the total number of outstanding contracts that are held by market participants at the end of each day , normally Open interest support the treend. If we have a growing OI and a price that goes upwards most likely the positive trend will continue , if instead the price goes down and OI goes up it means that a bearish trend is supported . when OI drops it means that we are probably at the end of a trend. Open interest is applied not only to the price but also to the two types of options that we have Put and Call. In our specific case we are interested to see that Open interest of the PUT Options is in increase , more "insurances" are made more there is the possibility of continuation of a bullish trend. Put/Call volume identifies the columns of put or call options , an imbalance of this ratio makes us identify points where probably large whales have made purchases. As you can see in this study , in mid-June there was a collapse of open interest that accompanied the bearish trend, smart money closed the bearish positions they had . From that moment the price turns upwards we can see the first purchases on the variation of the PUT/CALL volume in late June and subsequent in the second half of July. In order to determine the continuation of the trend we have used Open interest is of the price that of the options put that like explained previously their increment confirmation the direction of the trend of the price. Using this tool you could identify the trend and its robustness already at the end of June. As you see using this tool will allow you to be more confident in your trades and be much more precise than a classic technical analysis of the price.